CertWatch v0.5: Native cert-manager Integration for Kubernetes Certificate Monitoring

TL;DR: CertWatch v0.5.x introduces native cert-manager integration—the first tool to monitor Kubernetes Certificate CRDs directly, not just scrape Prometheus metrics. Get renewal predictions, failure detection, and issuer context that other monitoring tools can't provide. Plus, our open-source agent now supports both network scanning and cert-manager watching in a single Helm deployment.
Want to try it now? Run this in your cluster:
helm install certwatch oci://ghcr.io/certwatch-app/helm-charts/cw-stack \
  --namespace certwatch --create-namespace \
  --set global.apiKey.value=YOUR_API_KEY \
  --set certManager.enabled=true
The Numbers:
- 500M+ monthly downloads of cert-manager
- 86% of new Kubernetes clusters use cert-manager for certificate automation
- 0 monitoring tools offered native Certificate CRD watching—until now
The Gap We're Filling
cert-manager is the de facto standard for certificate automation in Kubernetes. It handles issuance, renewal, and storage of certificates automatically. But here's the problem: automated doesn't mean monitored.
When cert-manager works, it's invisible. When it fails, you find out at 3 AM when your services start returning TLS errors.
The existing options for monitoring cert-manager certificates are:
| Approach | What It Does | What It Misses |
|---|---|---|
| Prometheus scraping | Reads certmanager_certificate_* metrics | No CRD context, no failure reasons, no issuer info |
| TLS Secret watchers | Monitors the resulting Secret | Doesn't understand Certificate lifecycle |
| Event watchers | Catches Kubernetes Events | Only events, no certificate status |
None of these tell you why a renewal failed, when the next renewal is scheduled, or which issuer is having problems.
CertWatch v0.5.x changes that.
What's New in v0.5.x
Native cert-manager Controller
The new cw-agent-certmanager is a Kubernetes controller that watches Certificate CRDs directly:
                    ┌──────────────────────────────────────────────────────────────────┐
                    │                     Kubernetes Cluster                           │
                    │                                                                  │
                    │  ┌─────────────────┐   ┌─────────────────┐   ┌─────────────────┐ │
                    │  │   Certificate   │   │ CertificateReq  │   │     Events      │ │
                    │  │   (my-app-tls)  │   │   (pending)     │   │   (failures)    │ │
                    │  └────────┬────────┘   └────────┬────────┘   └────────┬────────┘ │
                    │           │                     │                     │          │
                    │           └─────────────────────┼─────────────────────┘          │
                    │                                 │                                │
                    │                    ┌────────────▼─────────────┐                  │
                    │                    │  cw-agent-certmanager    │                  │
                    │                    │  (watches CRDs directly) │                  │
                    │                    └────────────┬─────────────┘                  │
                    │                                 │                                │
                    └─────────────────────────────────┼────────────────────────────────┘
                                                      │ Outbound HTTPS
                                                      ▼
                                            ┌────────────────────┐
                                            │  CertWatch Cloud   │
                                            │  Dashboard + Alerts│
                                            └────────────────────┘
What You Get That Others Don't
| Capability | Prometheus Scraping | CertWatch v0.5.x |
|---|---|---|
| Expiry date | ✅ Yes | ✅ Yes |
| Ready status | ✅ Yes | ✅ Yes |
| Renewal prediction | ❌ No | ✅ status.renewalTime |
| Issuing status | ❌ No | ✅ Detect stuck renewals |
| Failed attempts count | ❌ No | ✅ status.failedIssuanceAttempts |
| Issuer context | ❌ No | ✅ Which CA issued this |
| Failure reasons | ❌ No | ✅ From CertificateRequest + Events |
| Namespace/Name identity | ❌ No | ✅ Full K8s identity |
The Killer Feature: Renewal Prediction
With Prometheus metrics, you know when a certificate expires. With CertWatch, you know when cert-manager plans to renew it:
status:
  notAfter: "2026-04-14T10:00:00Z"      # Expires in 100 days
  renewalTime: "2026-03-30T10:00:00Z"   # Renews in 85 days
This means you can alert before renewal should happen, not after it fails:
- Day 85: "Certificate renewal scheduled for tomorrow"
- Day 86: "Certificate should have renewed but hasn't—investigating"
- Day 87: "Renewal failed: rate limit exceeded"
Compare that to finding out on day 100 when everything breaks.
Real Scenario: The Rate Limit Trap
Let's walk through a scenario that happens more often than you'd think.
The Setup:
- You have a wildcard certificate for
*.example.com - cert-manager is configured to renew 15 days before expiry
- Let's Encrypt is your issuer
What Happens:
Day 0:   Certificate issued, valid for 90 days
Day 75:  cert-manager attempts renewal
         ❌ Let's Encrypt returns: "Rate limit exceeded"
         Certificate status: Ready=False, Reason=RateLimitExceeded
Day 76:  cert-manager retries, fails again
Day 77:  cert-manager retries, fails again
         ...
Day 89:  Old certificate still valid (barely)
Day 90:  💥 Certificate expires, production down
What Prometheus Tells You:
certmanager_certificate_expiration_timestamp_seconds > time()
# Result: 1 (certificate is valid)
The metric says "valid" because the current certificate hasn't expired yet. Prometheus doesn't know that renewal is failing.
What CertWatch Tells You:
🚨 Alert: Certificate renewal stuck
   Certificate: default/wildcard-example-com
   Status: Ready=False
   Reason: RateLimitExceeded
   Message: "Failed to create Order: rate limit exceeded"
   Current cert expires: 15 days
   Failed attempts: 3

   Action needed: Check Let's Encrypt rate limits at
   https://letsencrypt.org/docs/rate-limits/
You get this alert on Day 75—not Day 90. That's 15 days to fix the problem before anyone notices.
The Fix:
- Realize you hit the duplicate certificate limit
- Consolidate your wildcard requests
- Or switch to a different ACME account temporarily
Crisis averted. No 3 AM pages. No customer complaints.
Quick Start: Deploy in 2 Minutes
Option 1: Both Agents (Recommended)
The new cw-stack umbrella chart deploys both the network scanner and cert-manager controller:
helm install certwatch oci://ghcr.io/certwatch-app/helm-charts/cw-stack \
  --namespace certwatch --create-namespace \
  --set global.apiKey.value=cw_your_api_key \
  --set agent.enabled=true \
  --set certManager.enabled=true \
  --set cw-agent.agent.name=network-scanner \
  --set cw-agent-certmanager.agent.name=k8s-cluster
That's it. Your cert-manager certificates will appear in your CertWatch dashboard within 30 seconds.
Option 2: cert-manager Only
If you just want cert-manager monitoring:
helm install cw-agent-certmanager oci://ghcr.io/certwatch-app/helm-charts/cw-agent-certmanager \
  --namespace certwatch --create-namespace \
  --set agent.name=my-cluster \
  --set apiKey.value=cw_your_api_key
Option 3: Network Scanner Only
For monitoring external endpoints and private infrastructure:
helm install cw-agent oci://ghcr.io/certwatch-app/helm-charts/cw-agent \
  --namespace certwatch --create-namespace \
  --set agent.name=my-cluster \
  --set apiKey.value=cw_your_api_key \
  --set certificates[0].hostname=api.example.com
Production Deployment
For production, store the API key in a Kubernetes Secret:
kubectl create namespace certwatch

kubectl create secret generic cw-api-key \
  --namespace certwatch \
  --from-literal=api-key=cw_your_api_key
Then reference it in your values:
# certwatch-values.yaml
global:
  apiKey:
    existingSecret:
      name: cw-api-key

agent:
  enabled: true

certManager:
  enabled: true

cw-agent:
  agent:
    name: production-scanner
  certificates:
    - hostname: api.mycompany.com
      tags: [production, api]
    - hostname: postgres.internal:5432
      protocol: tls
      tags: [production, database]

cw-agent-certmanager:
  agent:
    name: k8s-certificates
    watchAllNamespaces: true
  podDisruptionBudget:
    enabled: true
    minAvailable: 1
helm install certwatch oci://ghcr.io/certwatch-app/helm-charts/cw-stack \
  --namespace certwatch \
  -f certwatch-values.yaml
Store certwatch-values.yaml in Git. Deploy with ArgoCD or Flux. Configuration as code.
The Private Certificate Problem (Solved)
cert-manager monitoring is one piece of the puzzle. But what about:
- Internal APIs between microservices
- Database connections (PostgreSQL, MySQL with TLS)
- VPN gateways and internal endpoints
- Staging and development environments
- Legacy systems not managed by cert-manager
These certificates are invisible to public monitoring tools. They exist behind firewalls, in private VPCs, on internal networks.
The cw-agent network scanner handles this:
# certwatch.yaml
certificates:
  # Internal API gateway
  - hostname: api.internal.corp
    port: 443
    tags: [production, api]

  # Database with TLS
  - hostname: postgres.internal.corp
    port: 5432
    tags: [production, database]

  # VPN endpoint
  - hostname: vpn.corp.example.com
    port: 8443
    tags: [infrastructure, vpn]
The agent runs inside your network, scans these endpoints, and pushes data to CertWatch via outbound HTTPS. No inbound firewall ports required.
Combined with cert-manager monitoring, you get visibility into:
- ✅ Public domains (scanned from your infrastructure)
- ✅ Private endpoints (scanned locally)
- ✅ Kubernetes certificates (watched via CRDs)
- ✅ Non-cert-manager TLS (databases, VPNs, legacy systems)
All in one dashboard:
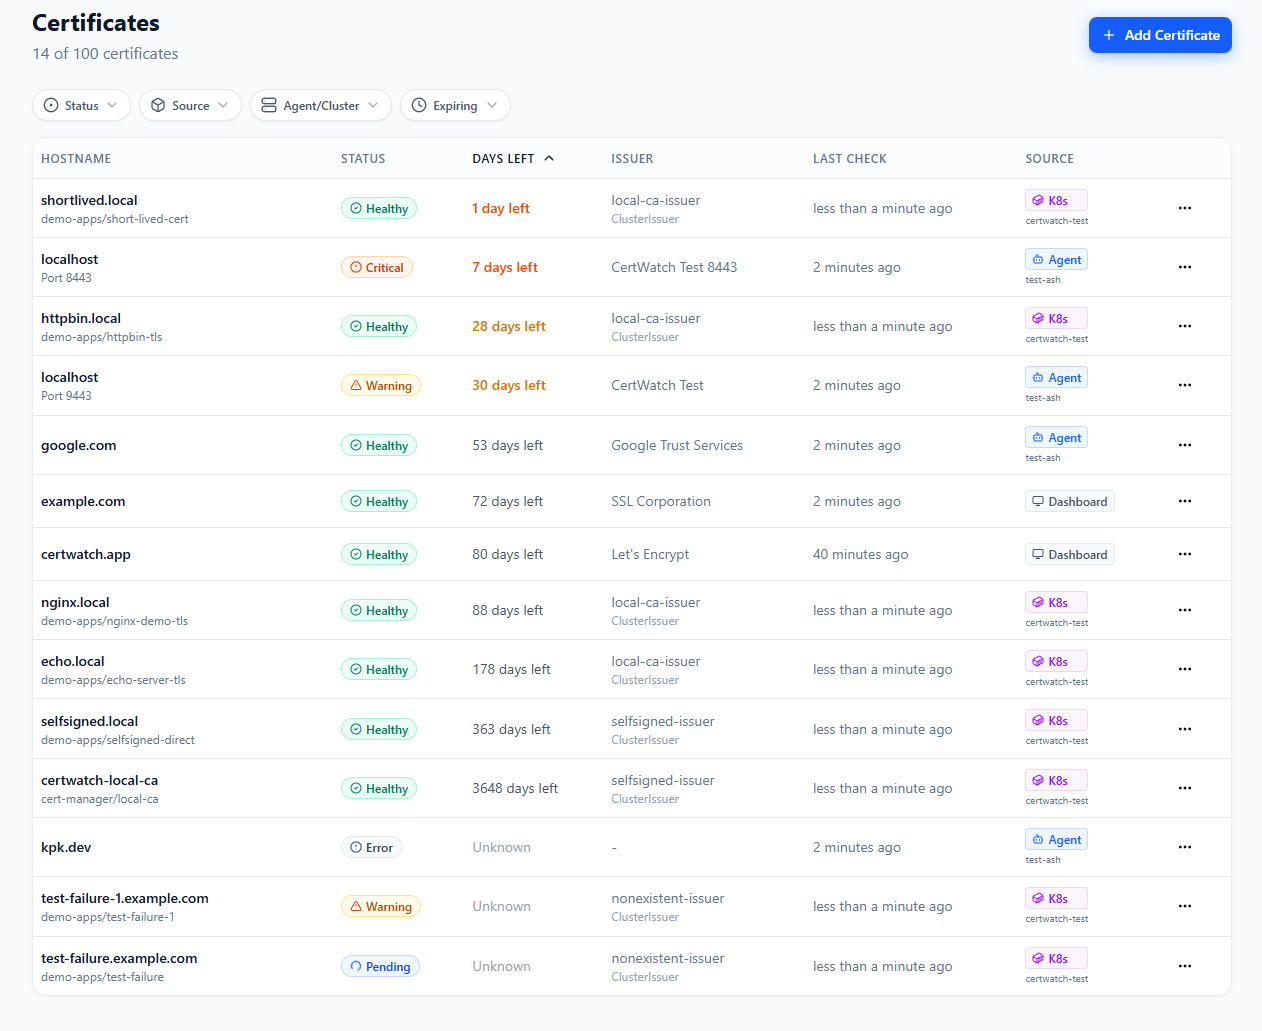
Real dashboard showing certificates from cert-manager (K8s badges), network agents, and manually added domains—all in a single view. Filter by source, status, or expiry to find what matters.
How We Compare
We're not trying to replace your entire monitoring stack. CertWatch is purpose-built for certificate monitoring and designed to complement what you already have.
vs. Prometheus + Blackbox Exporter
| Aspect | Prometheus Stack | CertWatch |
|---|---|---|
| Setup time | Hours (config, alerts, dashboards) | Minutes |
| cert-manager depth | Metrics only | Full CRD context |
| Silent failure detection | Manual (if you remember) | Automatic heartbeats |
| Chain validation | Basic | Full leaf-to-root |
| Revocation checking | ❌ No | ✅ OCSP/CRL |
| Maintenance | Self-managed | Zero |
Prometheus is excellent for metrics. But setting up SSL monitoring requires Blackbox Exporter config, AlertManager rules, and Grafana dashboards. CertWatch gives you the same visibility without the YAML gymnastics.
You can use both: The cw-agent exposes a /metrics endpoint. Scrape it into your existing Prometheus if you want certificate metrics in Grafana.
vs. TrackSSL and Similar Tools
| Aspect | TrackSSL | CertWatch |
|---|---|---|
| cert-manager integration | ❌ No | ✅ Native CRD watching |
| Private agent check interval | 4 hours | Configurable (1 min - 24 hrs) |
| Agent source code | Viewable only | Open-source (Apache 2.0) |
| Kubernetes deployment | Docker container | Native Helm chart |
| Configuration style | Web UI | YAML + CLI (GitOps) |
TrackSSL pioneered dedicated SSL monitoring, and they've built a solid product. But it was designed for static servers and IT administrators. CertWatch is built for dynamic infrastructure where pods die, IPs change, and configuration lives in Git.
vs. Better Stack, Uptime Robot, etc.
These are excellent uptime monitoring tools. But SSL monitoring is a checkbox feature for them—they check expiration dates, not certificate chains, revocation status, or cert-manager health.
Use them for uptime. Use CertWatch for certificates.
What's Coming Next
v0.5.x is the foundation. Here's what we're working on:
File Scanning + Private CA (v0.6)
Monitor local .pem, .crt, and .key files directly. Support custom CA bundles for internal PKI chain validation. This is a unique differentiator—no competitor offers local file scanning with private CA support.
# Coming in v0.6.0
files:
  - path: /etc/ssl/certs/internal-api.pem
    tags: [production, internal]
  - path: /opt/app/certs/*.crt
    tags: [app-certs]

ca:
  bundle: /etc/ssl/certs/internal-ca-bundle.pem
Auto-discovery (v0.7)
Auto-discover services in Kubernetes namespaces. "Deploy once, discover everything." Zero-config certificate discovery that finds TLS endpoints automatically.
# Coming in v0.7.0
discovery:
  kubernetes:
    namespaces: ["*"]
    watchIngresses: true
    watchServices: true
Multi-Cluster Views (v0.8)
See the same Certificate name across clusters:
Certificate: api-gateway/tls-cert
├── prod-us-cluster    ✅ Ready, expires in 45 days
├── prod-eu-cluster    ✅ Ready, expires in 44 days
└── staging-cluster    ⚠️ Issuing (renewal in progress)
Open Source, Always
Both agents are open-source under Apache 2.0:
- cw-agent: github.com/certwatch-app/cw-agent
- Helm charts: Available via OCI registry
You can audit the code, fork it, contribute to it. The SaaS dashboard is our business model, not the agent code.
Security by Design
The agents are built with security in mind:
- Outbound-only connections — No inbound firewall ports
- Read-only RBAC — cert-manager agent only reads CRDs
- Distroless containers — No shell, no package manager, minimal attack surface
- Non-root execution — Runs as unprivileged user
FROM gcr.io/distroless/static:nonroot
COPY cw-agent /
USER nonroot:nonroot
ENTRYPOINT ["/cw-agent"]
Try It Free
CertWatch is in public beta. During beta, you get:
- Generous certificate limits — Monitor your infrastructure without hitting paywalls
- All features included — Slack, PagerDuty, Teams, Email, Webhooks
- Unlimited team members — No per-seat pricing
- Shape the product — Your feedback directly influences our roadmap
Get Started
- Sign up at certwatch.app
- Get your API key from the dashboard
- Deploy the agents using Helm (see Quick Start above)
- See your certificates in the dashboard within 30 seconds
We'd Love Your Feedback
We built CertWatch because we've experienced the pain of certificate outages ourselves—both public and private. The cert-manager integration came from real frustration with existing tools that only scraped metrics without understanding the Certificate lifecycle.
If you try it out, we'd love to hear:
- What works well
- What's missing
- What would make this invaluable for your team
Join the conversation:
Changelog: v0.5.x
v0.5.0
- cert-manager integration — New
cw-agent-certmanagercontroller for monitoring Kubernetes certificates - cw-stack umbrella chart — Deploy one or both agents with a single Helm release
- Global API key support — Share API key configuration across subcharts
- PodDisruptionBudget — High availability support for cert-manager controller
- Documentation overhaul — New comprehensive guides
Previous Releases
- v0.4.0 — Helm chart, GitOps support, Prometheus ServiceMonitor
- v0.3.0 — Prometheus metrics, health endpoints, heartbeat support
- v0.2.0 — Interactive setup wizard, agent state persistence
Further Reading
- Kubernetes Deployment Guide
- cert-manager Integration Docs
- Private SSL Certificate Monitoring
- SSL Certificate Expiration Guide
cert-manager is a Cloud Native Computing Foundation project. We're proud to build on their excellent work and contribute to the Kubernetes ecosystem.
Never Let a Certificate Expire Again
Monitor your SSL certificates with CertWatch. Get alerts before they expire, validate certificate chains, and keep your services running smoothly.